The data said so.
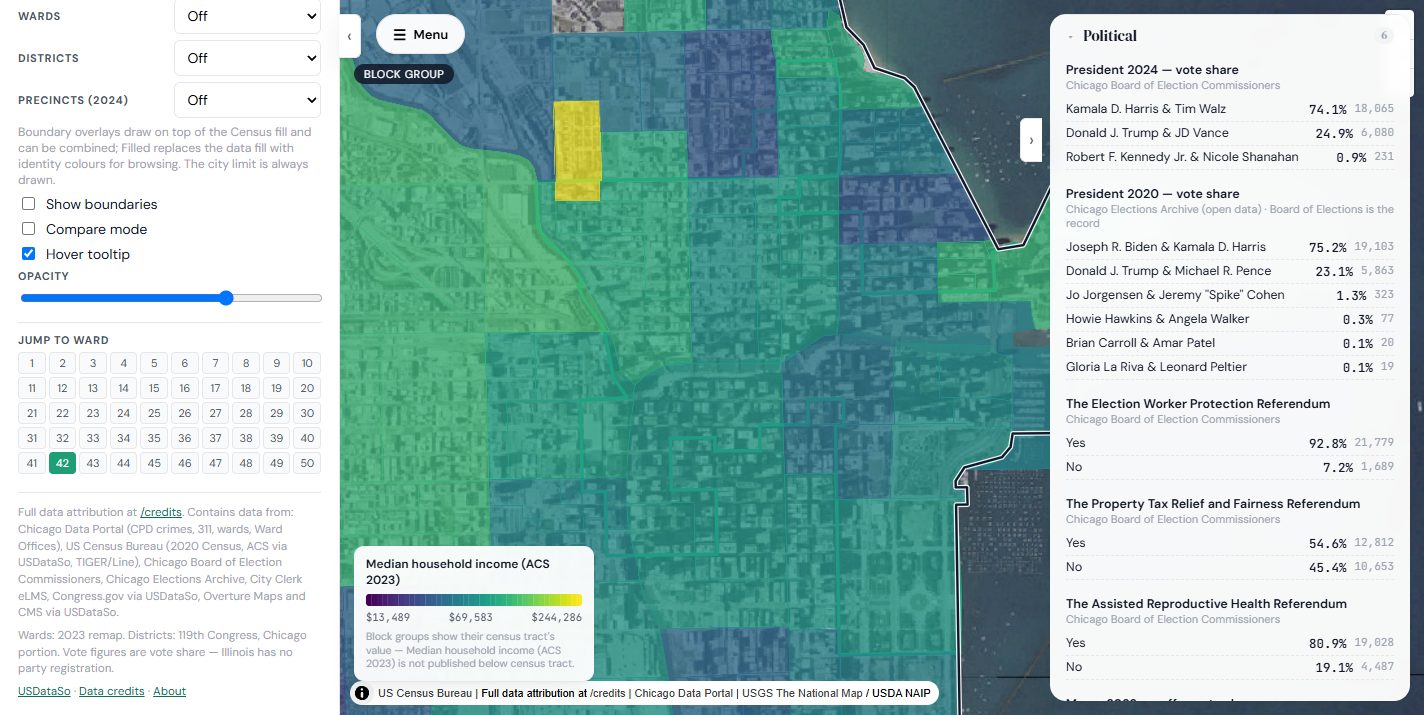
Census, CDC, EPA, CMS, FCC, Congress, the Chicago Data Portal — a dozen public sources that never sit in the same place, brought together on one map. Who lives here, what they earn, how healthy they are, how they voted. Down to the census tract nationally. Down to the block in Chicago.
The idea
It all exists. It just doesn't exist together.
The Census Bureau knows who lives on your block. The CDC knows how healthy the neighborhood is. The EPA knows what's in the air. CMS knows where the doctors are. The FCC knows who owns the radio station. Congress publishes every vote. Chicago publishes every crime report and every 311 call.
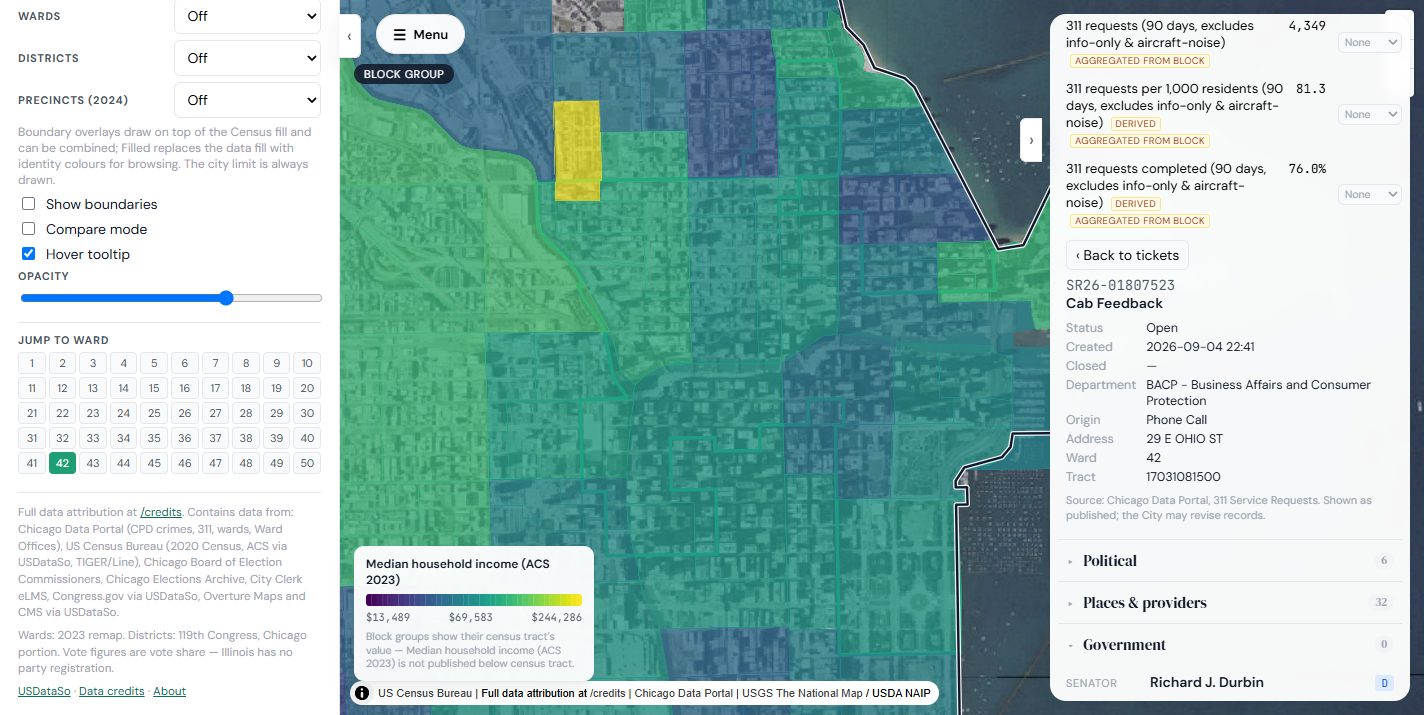
Every one of those datasets is public, and every one lives in its own portal, its own format, its own vocabulary — so nobody ever sees them side by side. SaidSo's maps join them at the geography where you live, so one click on one place returns the whole picture. The data said so — and you can see which data.
- Census Bureau · ACS & 2020 CensusPopulation, income, education, age, race and ethnicity, housing
- CDC PLACES · AHRQ SDOHHealth outcomes, behaviors, social determinants
- EPA EJScreenAir quality, environmental burden, proximity to hazards
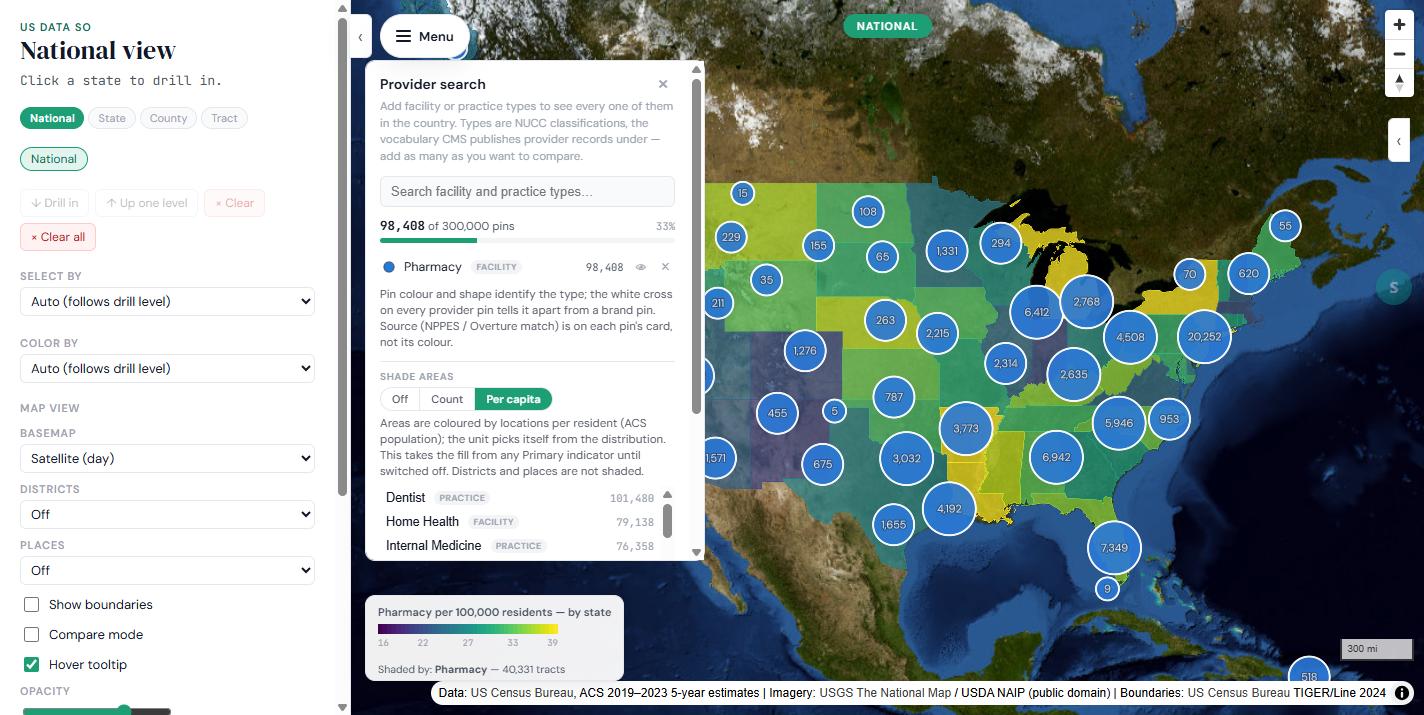
- CMS NPPESEvery licensed healthcare provider, by specialty
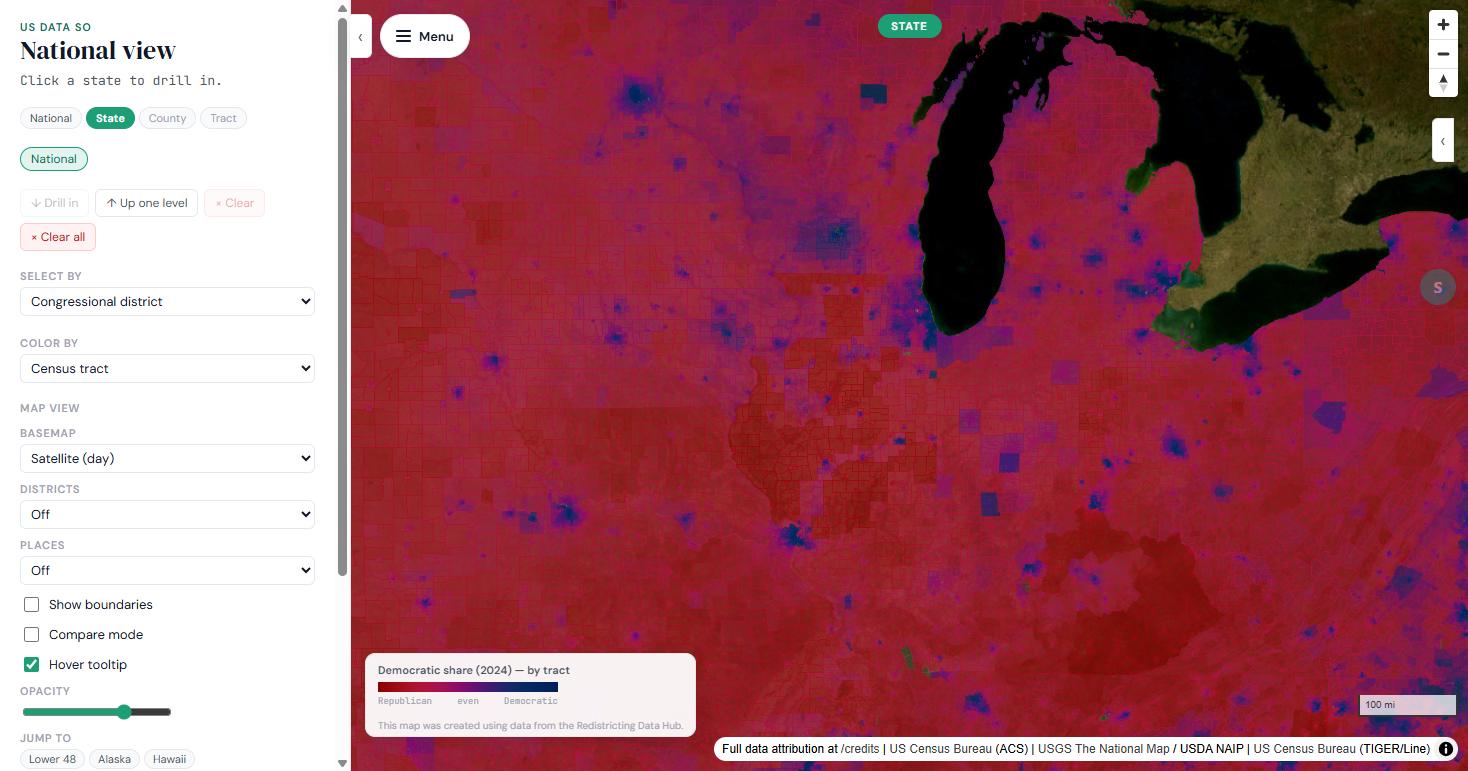
- Redistricting Data Hub · MIT Election Lab · Chicago Board of Elections2024 results at precinct level
- Congress.gov · Chicago City ClerkBills, roll-call votes, committees, attendance
- FCC LMSEvery licensed radio and TV station, and who owns it
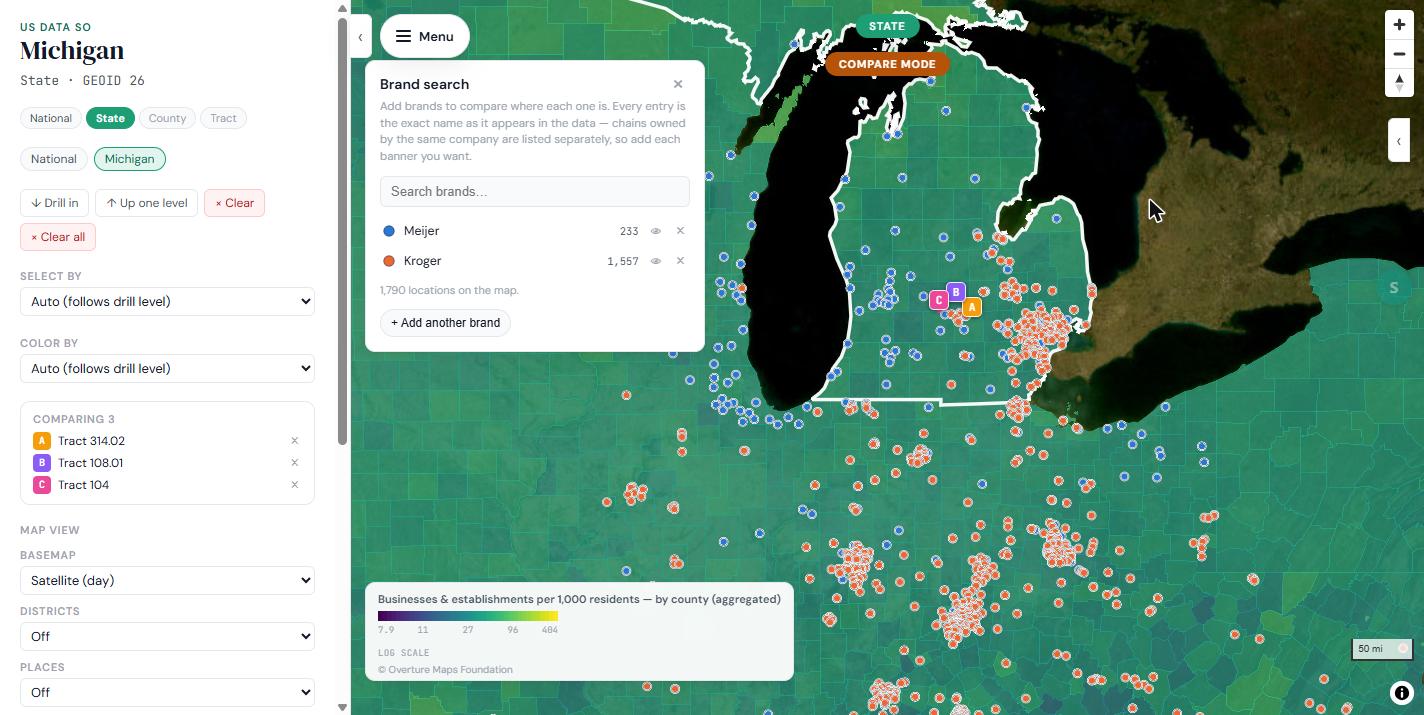
- Census LEHD · Overture MapsWhere people work; every business on the ground
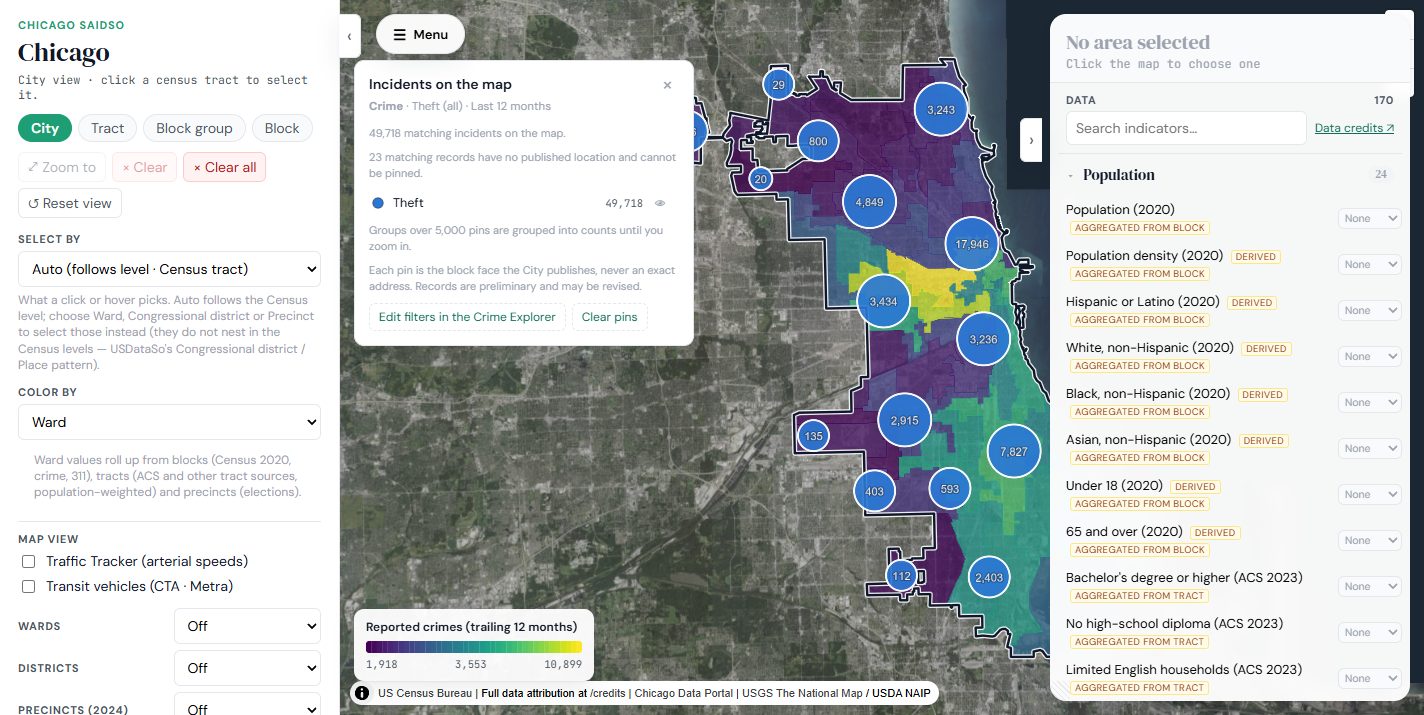
- Chicago Data Portal · CPD12 months of reported crime, block by block
- Chicago Data Portal · 31190 days of service requests, every ticket
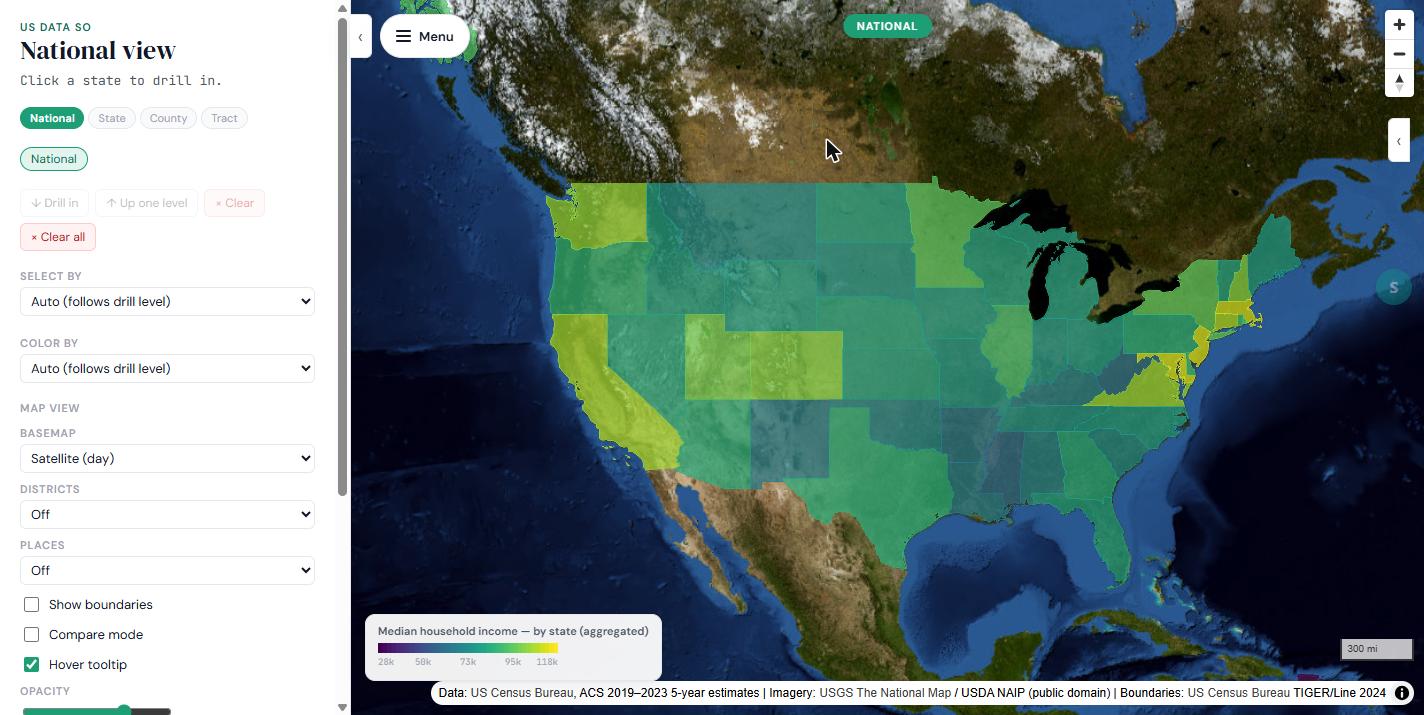
- Median household incomeCensus ACS
- Population · age · race · housingCensus
- Adult health outcomesCDC PLACES
- PM2.5 exposureEPA EJScreen
- Providers per 100k residentsCMS NPPES
- 2024 vote sharePrecinct results
- Your representative’s recordCongress.gov
- Businesses per 1,000 residentsOverture Maps
Start with who lives here
Demographics first. Everything else on top.
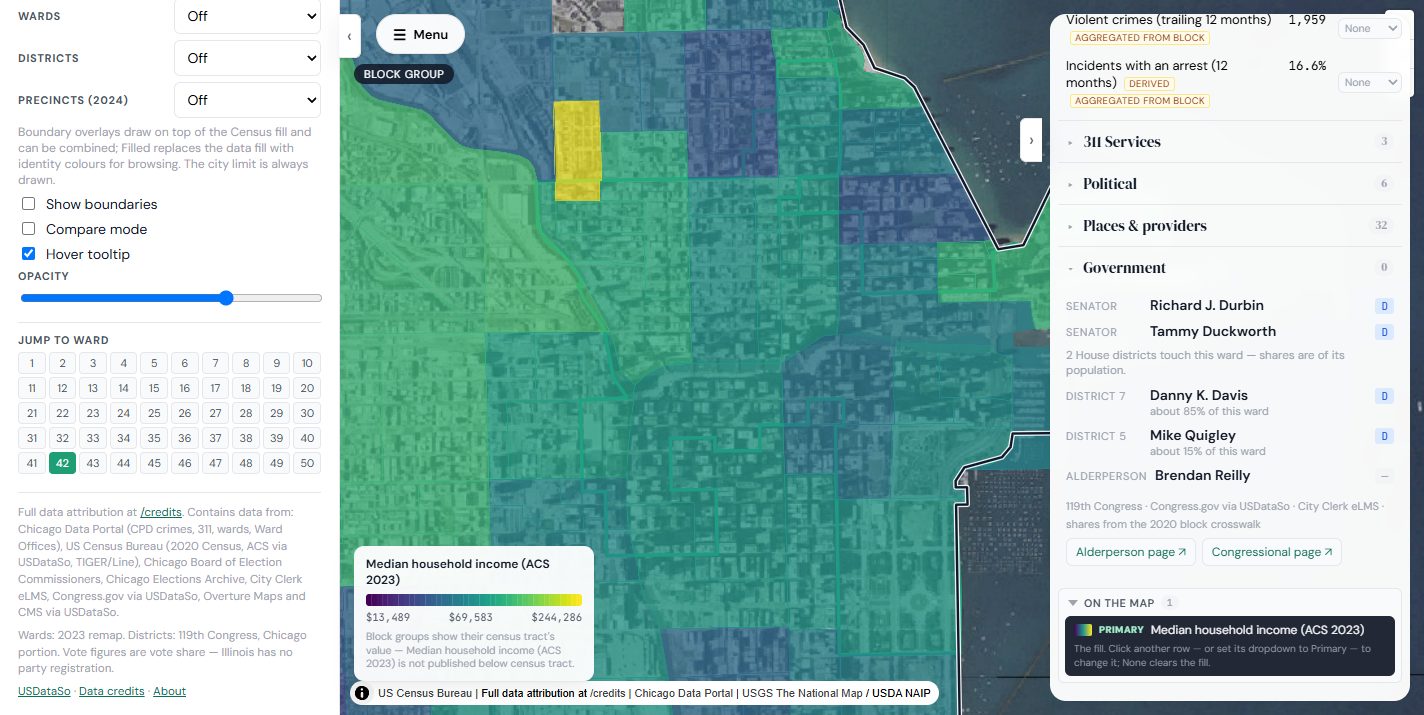
Every map in the family starts from the same base layer: the Census Bureau's portrait of a place — population, income, age, race and ethnicity, education, housing. Health, environment, elections, crime, and services are all read against it, so a number is never just a number. It's a number about these people, in this place.
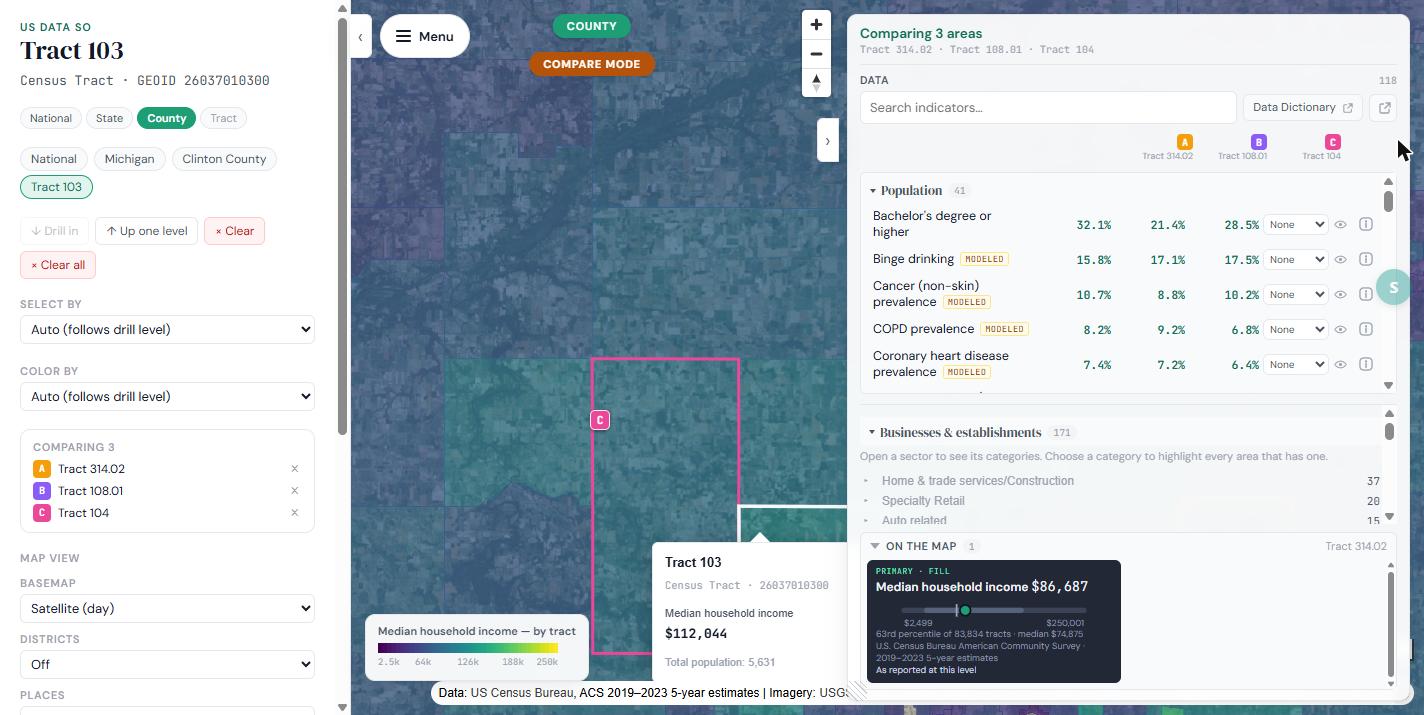
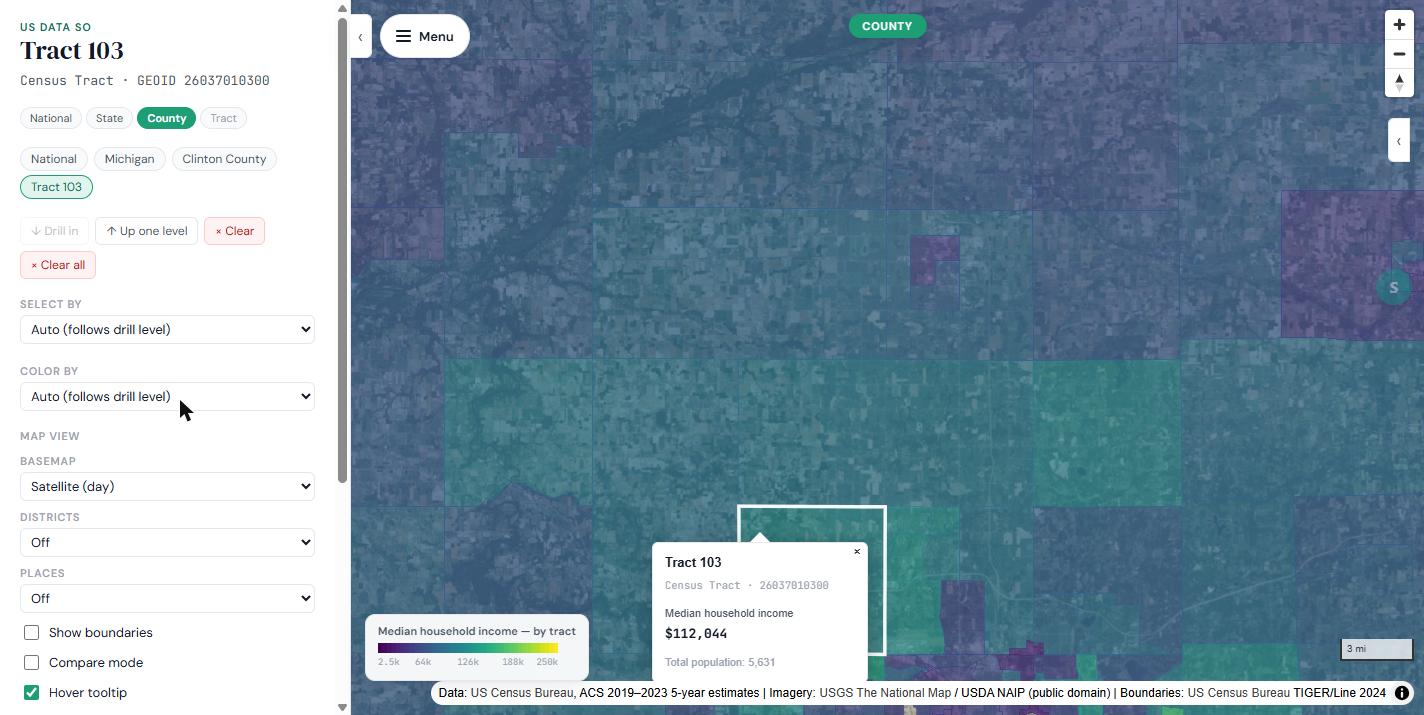 85,000+ census tractsIncome and population for one tract of 5,631 people — finer than zip code, finer than city.
The base layer
- Population and density
- Median household income
- Age — under 18, 65 and over
- Race and ethnicity
- Educational attainment
- Housing and households
- Limited-English households
- Where residents work
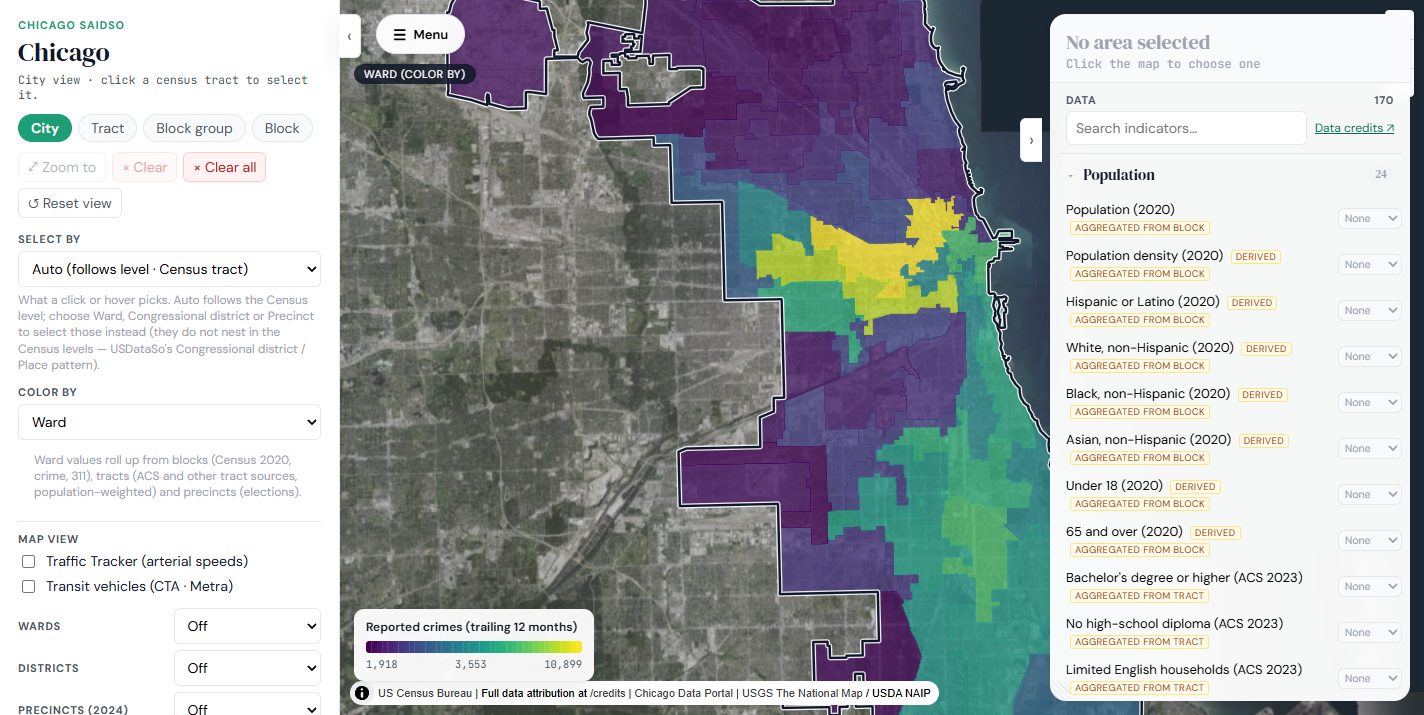
Census ACS 2019–2023 at every tract nationally; 2020 decennial counts at every one of Chicago's 38,790 census blocks.
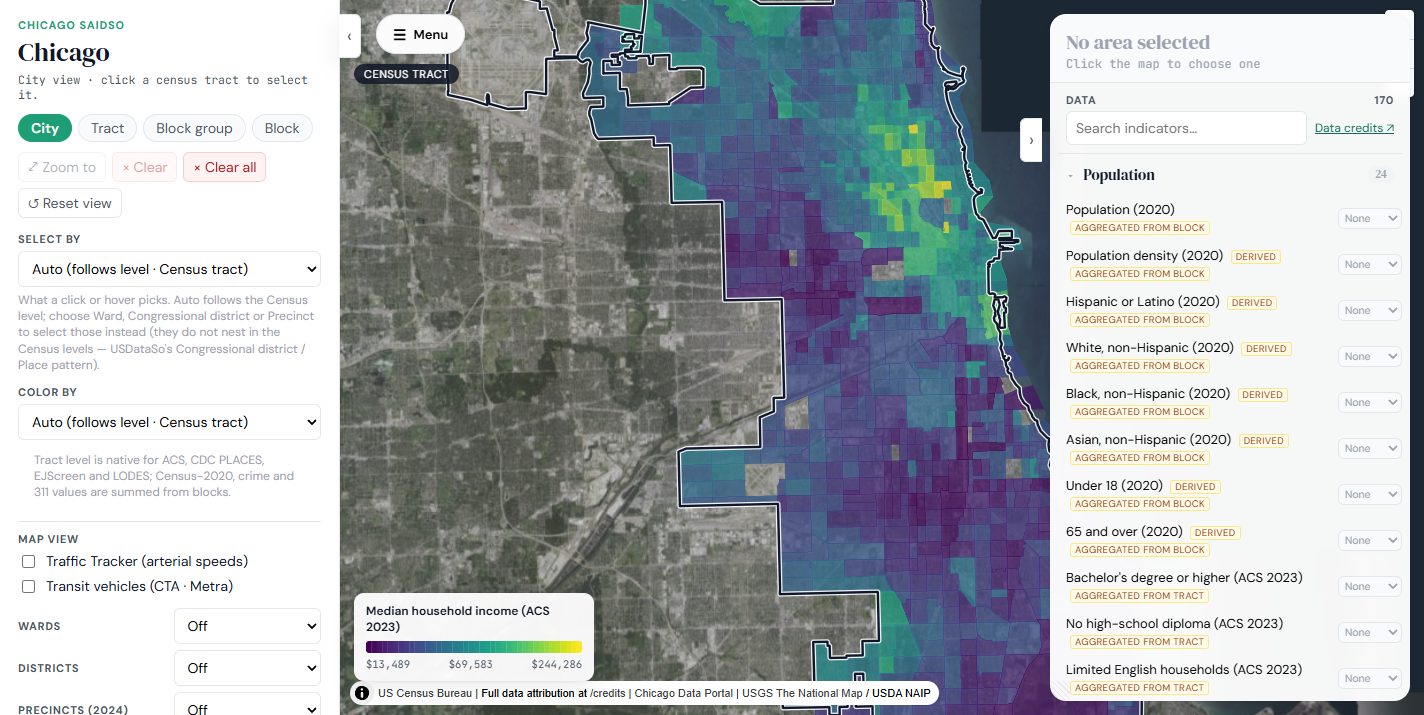 38,790 census blocksPopulation, race and ethnicity, age, and housing where the Census actually publishes them — then crime and 311 on top.
The family
He said. She said. The data said so.
Each product in this family proves the same point a different way — a claim about a place is only real once the public data backs it up, an agreement is only real once both sides confirm it, a fact about what you know is only real once it's on record, a rule of music is only worth learning once you can derive it. Instead of he said, she said — let the record decide.
Programs delivered
Built by Kyle Ewing · ITprojectMGMT.com · LinkedIn · The Doodle Principle