Public data · Free · No account · Live now

Chicago SaidSo

The city's data said so.

A free tool for exploring Chicago's civic data — 12 months of crime, 90 days of 311 service requests, block-level census demographics, ward maps with each alderperson's real voting record, and precinct-level elections. No account. No paywall. No spin.

It takes USDataSo's national public-data pattern to city scale — and it's built as the first implementation of a repeatable pattern any city could adopt.

Open Chicago SaidSo →Crime & 311, up close
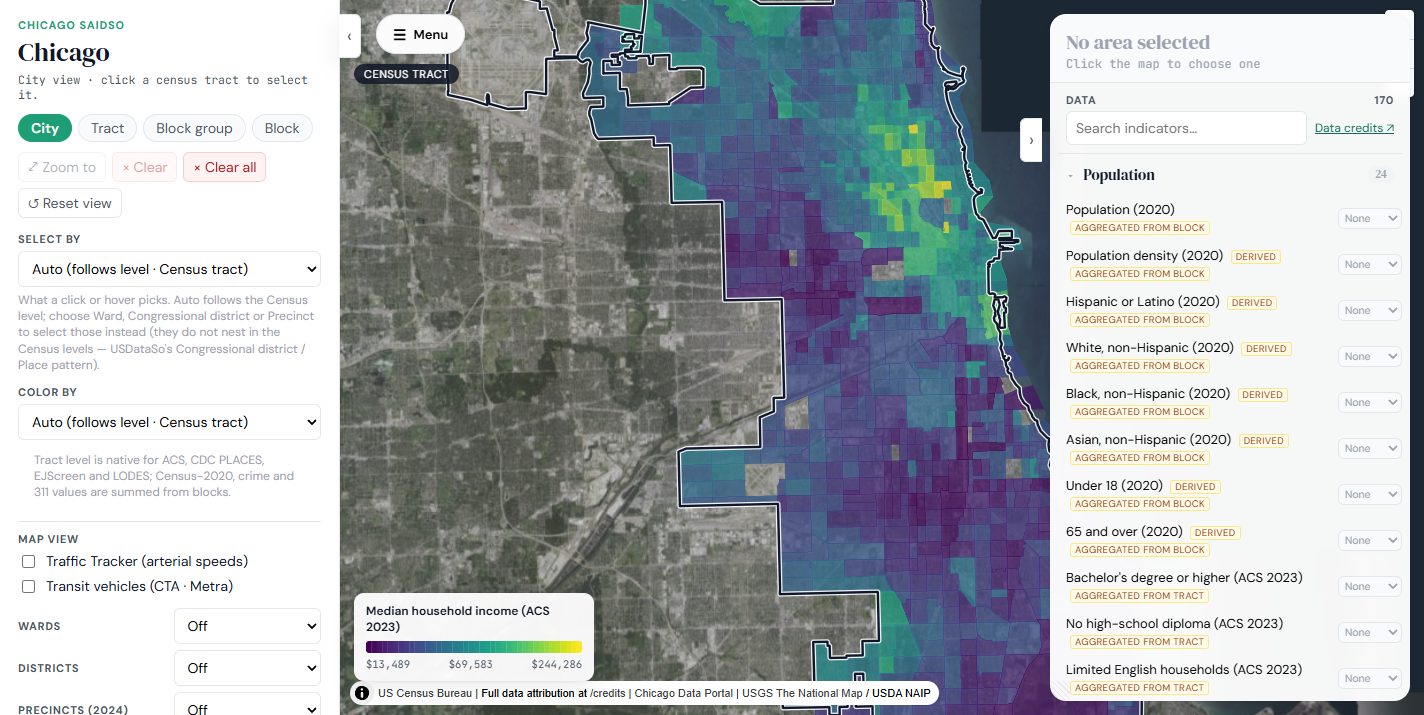
The Chicago SaidSo city view: Chicago shaded by median household income (ACS 2023) at census-tract level over a satellite basemap, with drill levels and Select By / Color By controls on the left and the Data panel's 170 indicators on the right.
~225k
Crime incidents on the map — a trailing 12 months, refreshed nightly
~600k
311 service requests — a trailing 90 days, every ticket readable
50
Wards, each with its alderperson’s actual voting record
38,790
Census blocks with 2020 population counts — finer than any tract

What it is

A city, on the record

Chicago publishes extraordinary data about itself: every reported crime, every 311 call about a pothole or a rat, every ward boundary, every aldermanic vote, every precinct's election result. It's all public — and almost none of it is usable by an ordinary resident without wrestling APIs, shapefiles, and portals that don't talk to each other.

Chicago SaidSo puts it on one map. Ask a concrete question — what actually gets reported on my block? Is it more or less than the next ward over? What did my alderperson vote for last month? How did my precinct vote? — and get an answer from the record, at the geography where you live, not a citywide average.

It's part of the SaidSo family, built on one idea: truth comes from data, not from anyone's word for it. Every number carries its source, its window, and its caveats — the city's data said so, and you can check.

What you can do

  • Drill from the city view into wards, census tracts, block groups, individual census blocks, and election precincts
  • Browse every crime type and description with 12-month counts, filter by ward, district, precinct, date, or an address radius — then show the incidents as pins on the map
  • Read individual 311 tickets — searchable full-text across 90 days of service requests, with status and category
  • See a ward’s alderperson — committees, sponsored legislation, roll-call votes, attendance — beside its federal delegation
  • Layer data types on one map and compare wards or tracts side by side
  • Toggle between raw counts and per-1,000-resident rates

The headline layers

Crime and 311, without the fog

Public safety and city services are where civic data gets argued about the most and examined the least. These two layers get the deepest treatment in the product — real incidents and real tickets, browsable, filterable, and mapped, with every window and every exclusion stated.

Crime
  • A trailing 12 months of CPD incidents — ~225,000 of them — re-ingested nightly
  • All 31 primary types with their full description tiers, each with honest counts
  • Filter by ward, congressional district, precinct, date, or address + radius
  • Choropleths by count, per-1,000 rate, violent subset, or arrest percentage
  • Individual incidents as map pins, with the true matching total always shown
311
  • A trailing 90 days of service requests — ~600,000 tickets — re-ingested nightly
  • 18 categories, from potholes and rats to graffiti and broken streetlights
  • Every individual ticket readable, with full-text search and status
  • Aggregates computed over the same window as the list — they can't disagree
  • Non-locational request types excluded from maps, disclosed, and still listed

Jump straight in: Crime Explorer · 311 Explorer

Why it exists

A public-service project, run like a program

Chicago SaidSo is a demonstration of what one person, AI-partnered development, and disciplined delivery can produce as a genuine public service: a working civic-data platform, free to every resident, on an edge stack that costs a few dollars a month.

It's run like a professional program, not a weekend hack: a documented knowledge base with every architecture decision and its rationale, a tracked debt register, nightly ingestion with run logging and external failure alerting, an OWASP API Top-10 control mapping, and an independent verification harness that re-derives the geography assignments with its own geometry before trusting them.

And it's deliberately the first of a repeatable pattern — a standalone, forkable structure another community could stand up on its own open-data portal.

Under the hood

  • Nightly self-ingesting Socrata pipelines
  • PostGIS ward ↔ tract ↔ precinct crosswalks
  • Per-incident point-in-polygon geography (block, tract, ward, district, precinct)
  • 22,350 aldermanic roll-call votes from City Clerk eLMS
  • Precinct-level election results across three map vintages
  • Full-text 311 ticket search over ~600k rows
  • Per-incident map pins, clustered until you zoom in
  • R2 artifact publishing with a build-stamp cache key
  • OWASP API Top-10 control mapping
  • A three-tier independent verification harness

Same stack as USDataSo, on purpose: MapLibre GL JS, D3, PostGIS, Cloudflare's edge — open source and open standards throughout, so the architecture can be understood, audited, and replicated by the next city.

Data sources

Which data said so

The same two-tier discipline as USDataSo: official government data and open data, labeled wherever the difference matters. Chicago's catalog is almost entirely official — the one open-tier election source is badged, with the official record named beside it.

Official government

Official government data

SourceWhat it coversUpdate cadenceLicense / terms
Chicago Data Portal — CrimesEvery CPD-reported incident at block level: type, description, arrest flag, location. The site serves a trailing 12 months.Nightly — the site re-ingests itself at 08:00 UTCCity of Chicago open data. Points are block-face midpoints as published by CPD — never exact addresses.
Chicago Data Portal — 311 Service RequestsEvery 311 ticket — type, department, status, location — for a trailing 90 daysNightly — 08:30 UTCCity of Chicago open data. Two non-locational request types are excluded from geographic counts and the exclusion is disclosed in the app (see the FAQ).
Chicago Data Portal — Wards & Ward Offices2023 ward boundaries and the 50-member alderperson roster with office detailsOn boundary or roster changeCity of Chicago open data.
City Clerk eLMSAldermanic legislative activity — sponsored ordinances, committee assignments, roll-call votes, attendancePeriodic re-ingestPublic legislative record. eLMS has documented attribution gaps upstream; the site presents what the record actually says.
Chicago Board of Election Commissioners2024 general election results at precinct level — President, three citywide referenda, nine U.S. House contests, across 1,291 precinctsOne-time for the 2024 cycleOfficial election record, scraped from the Board’s own results site.
U.S. Census Bureau2020 decennial counts for all 38,790 ward-assigned blocks; ACS 2019–2023 tract estimates via the shared USDataSo pipeline; TIGER/Line geographyDecennial / annualCensus API Terms of Service — attribution in the UI, no individual identification.
Federal layers via USDataSoCDC PLACES health outcomes, EPA EJScreen environmental burden, LEHD LODES jobs, and CMS NPPES healthcare providers — rolled onto Chicago’s wards, tracts, and precinctsFollows USDataSo’s cadencesPublic federal data, re-served from the shared backend. The CMS non-endorsement statement travels with the provider data.
Open data

Open data

SourceWhat it coversUpdate cadenceLicense / terms
Chicago Elections Archive2020 presidential and 2023 mayoral results at precinct level — the historical comparison behind the 2020 → 2024 shift viewOne-time per archived electionOpen-source project (MIT-licensed), badged as open data wherever it appears; the Board of Elections is named beside it as the official record.
Overture Maps PlacesBusiness and establishment density, scoped to Chicago, re-served from USDataSo’s ingestionFollows USDataSo’s monthly Overture refreshCDLA Permissive v2.0, with Foursquare-contributed records under Apache 2.0 — the full license texts and NOTICE file are served on the app’s own origin.

Every indicator, its source and methodology: Data Dictionary · every dataset, its license and known limits: Data Credits

How to use it

Eight things the map can do

Written for a first-time visitor. Every screenshot below is a real capture of the live app.

Crime Explorer

Twelve months of CPD incident data, organized the way the data actually is: 31 primary types, each expanding into its official descriptions, every row carrying a real citywide count. Tick any combination — all of Battery plus only theft-from-motor-vehicle, say — and filter it by ward, congressional district, precinct, date range, or an address and a radius.

It's the same incident data behind the Chicago Police Department's official ClearMap portal — the split is purpose, not source: ClearMap for official lookups, this for open-ended research, and the app says so with a link.
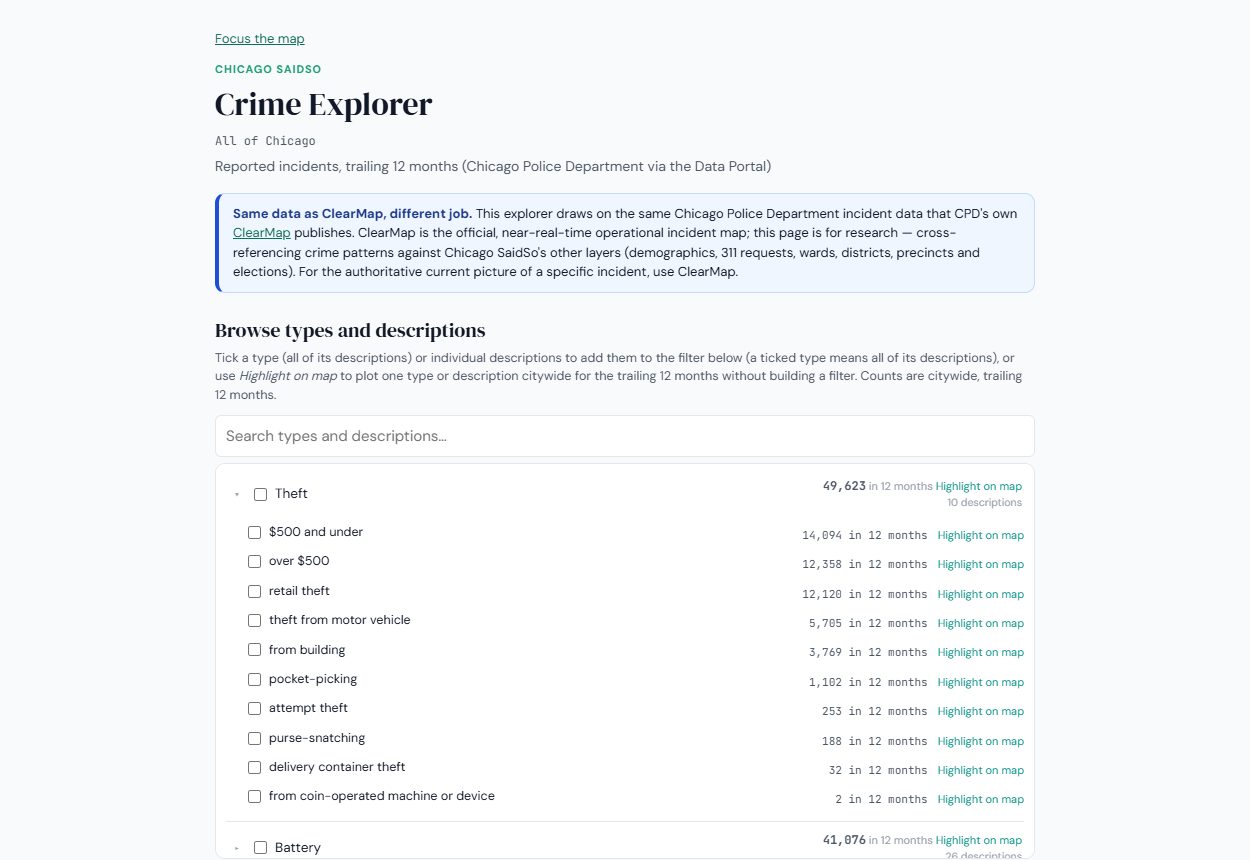
The Crime Explorer for all of Chicago, with Theft expanded to its ten descriptions — $500 and under (14,094 in 12 months), over $500 (12,358), retail theft (12,120), theft from motor vehicle (5,705) — each with a checkbox and a Highlight on map link, summing to Theft’s 49,623 citywide count, with Battery (41,076) below. A callout explains it draws the same Chicago Police Department data as CPD’s official ClearMap, framed for research.

Every incident, on the map

Any Explorer selection becomes pins on the map — individual incidents, not blurred heat. Click a pin and the full record loads: type, description, date, arrest status, and its block, ward, district, and precinct.

Dense areas group into counted clusters until you zoom in, and the panel always shows the true matching total — including the handful of records the city published without a location, which it names rather than silently drops.

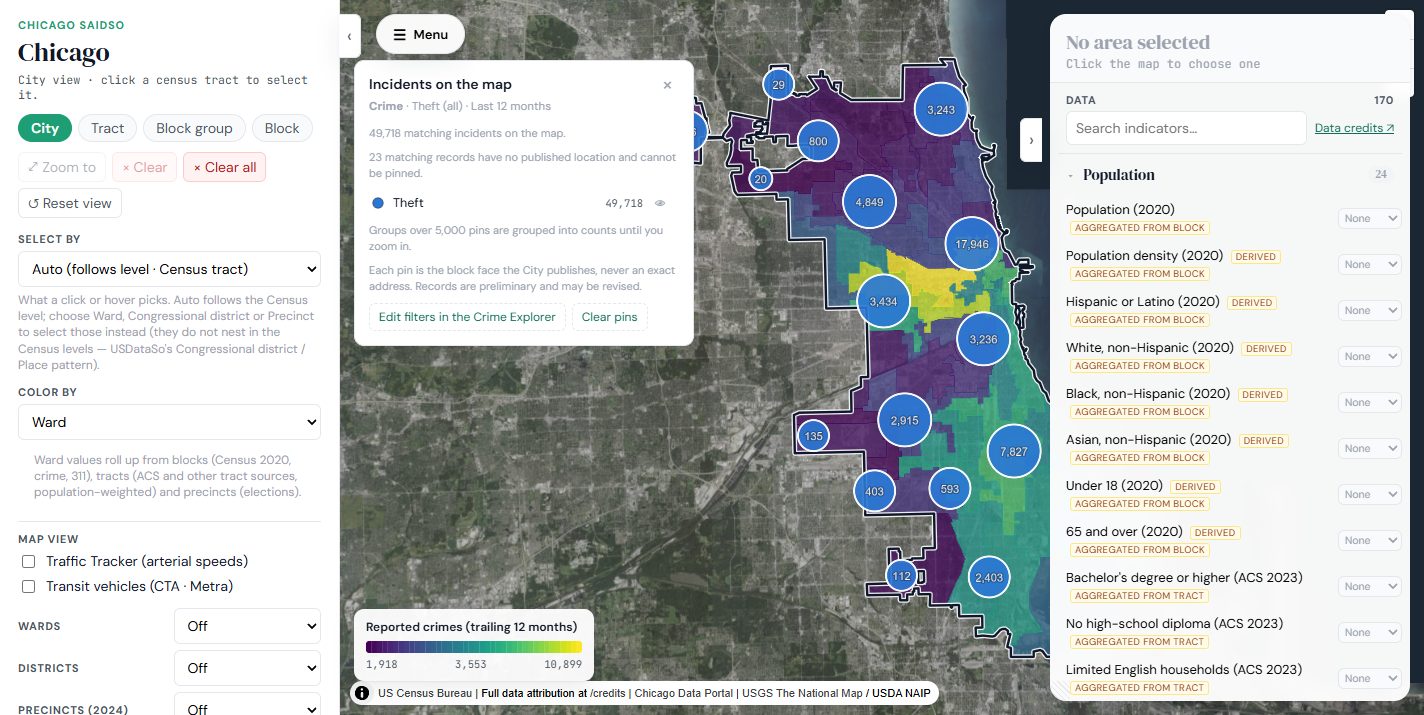
The Chicago map after Highlight on map for Theft: an “Incidents on the map” panel reporting 49,718 matching incidents over the last 12 months — noting that 23 records have no published location and cannot be pinned — with dense areas grouped into counted clusters until you zoom in, drawn over the ward-level crime choropleth.

311 Explorer

The same browsing pattern, pointed at 90 days of 311 service requests in 18 categories— potholes, rats, graffiti, abandoned vehicles, broken streetlights. Same filters, same address-radius search, same pins. The 90-day window is the dataset's scope itself, stated in the UI, and no filter combination quietly widens it.

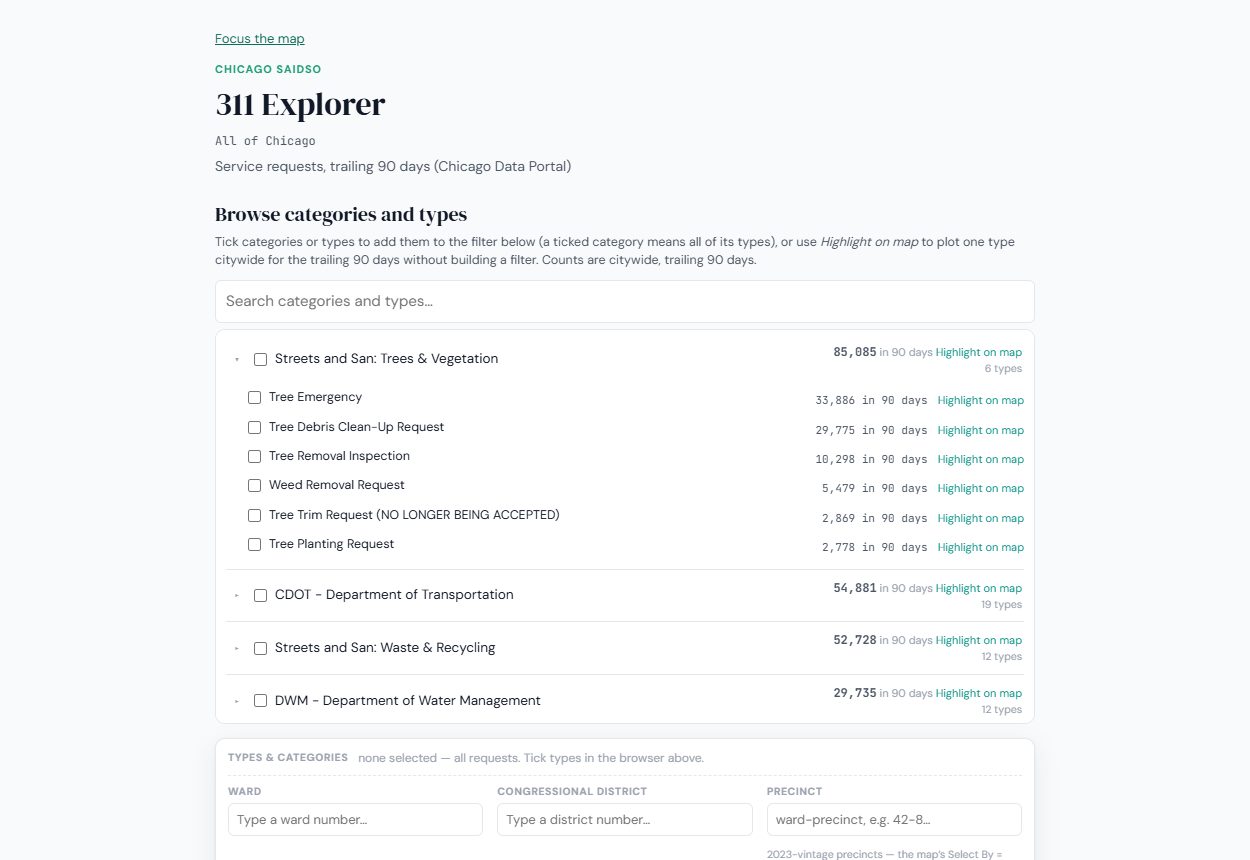
The 311 Explorer’s category browser: Streets and San — Trees & Vegetation expanded to show 85,085 requests in 90 days (Tree Emergency 33,886, Tree Debris Clean-Up 29,775, Tree Removal Inspection 10,298), with CDOT (54,881), Waste & Recycling (52,728), and Water Management (29,735) below, and ward / congressional district / precinct filter fields underneath.

311 ticket browser

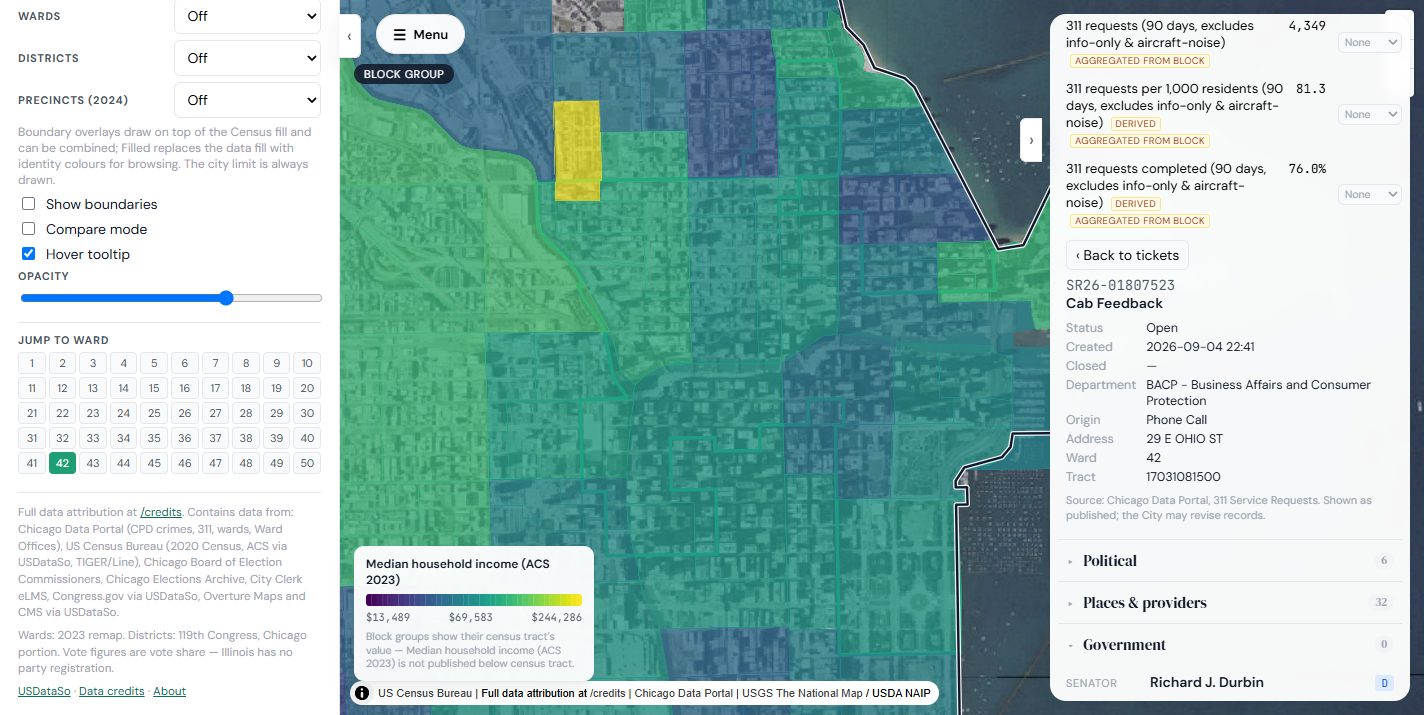
Beyond the aggregate counts, every individual ticket is readable — a list-and-detail browser inside the Data panel, scoped to whatever the map has selected, with full-text search across request types and status. Aggregates and tickets are computed over the same 90-day window, so the map and the list never disagree.

The Data panel for Ward 42 with its 311 indicators — 4,349 requests in 90 days, 81.3 per 1,000 residents, 76.0% completed — and a real ticket opened to its detail: SR26-01807523, Cab Feedback, status Open, department BACP, 29 E Ohio St, with a Back to tickets control and the Chicago Data Portal source line.

Wards and alderpersons

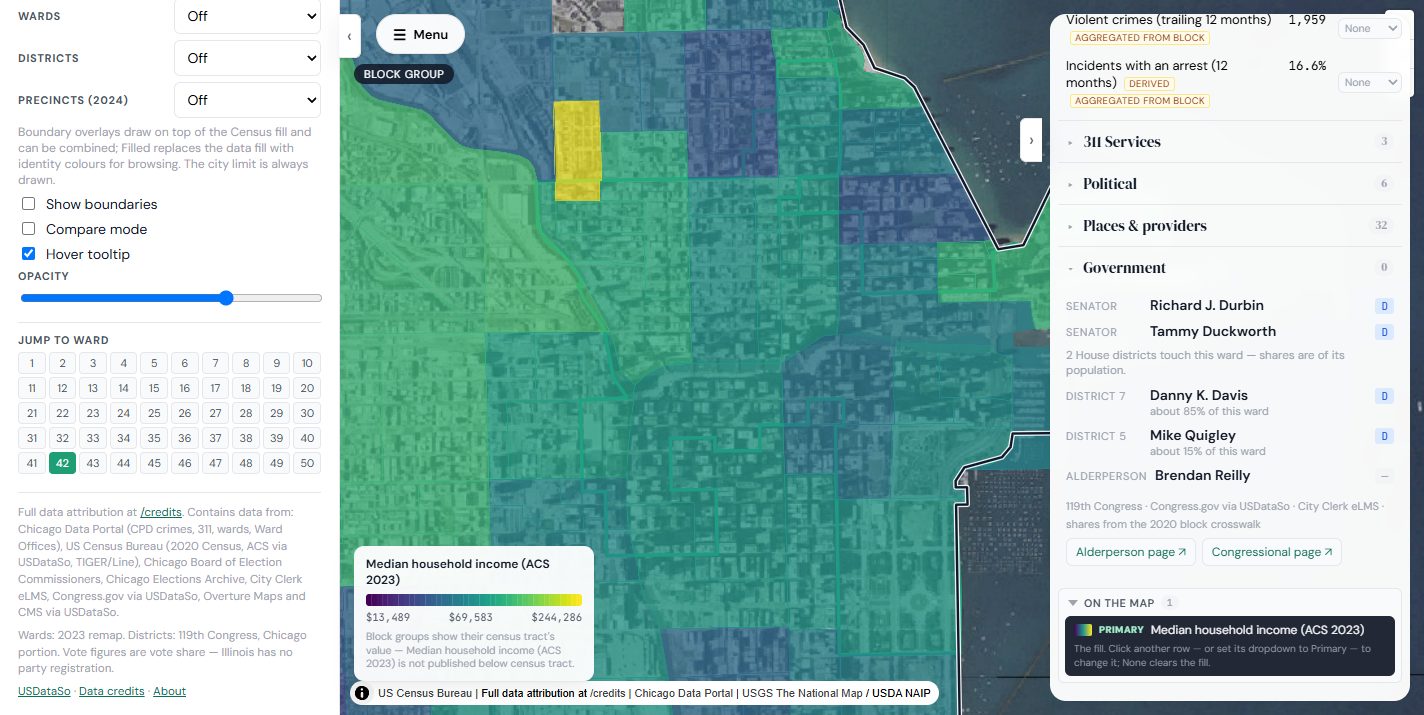
Click a ward and its government appears: the alderperson's committees, sponsored legislation, divided roll-call votes, and attendance — from the City Clerk's actual legislative record, not a bio page. Below it, the same ward's U.S. Senators and Representative, read from the shared USDataSo congressional data.

One Chicago-specific honesty rule: aldermanic elections are nonpartisan, so the app never invents a party label for an alderperson — and says why.

Ward 42 selected on the map, with the Data panel’s Government section showing both U.S. Senators, the two House districts touching the ward — District 7, about 85% of it, and District 5, about 15% — and Alderperson Brendan Reilly with a dash where a party would be, since the office is nonpartisan, plus links to the full alderperson and congressional pages.

Crime as a map layer

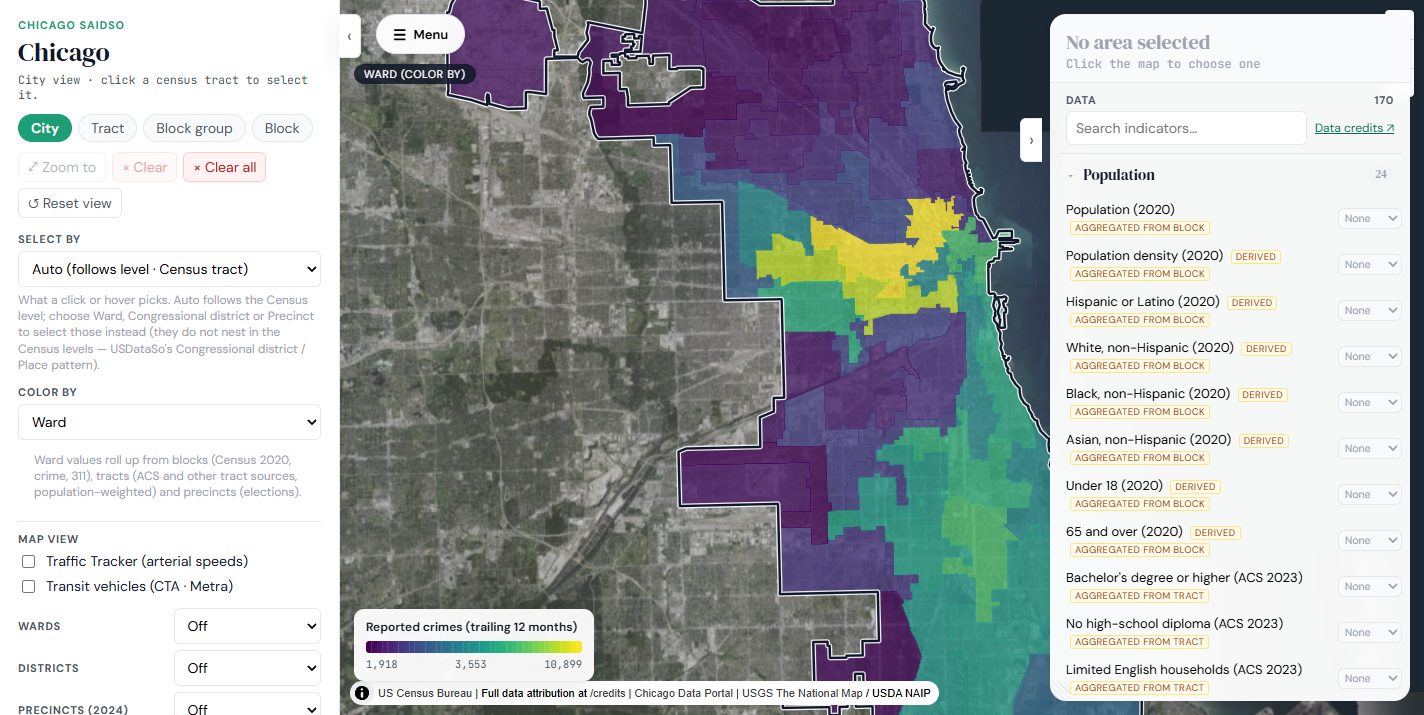
Crime is also an indicator like any other — count, per-1,000-resident rate, violent-crime subset, arrest percentage — paintable at ward, tract, block-group, block, or precinct level, and layerable over income, population, or any other indicator. That's the point of putting it in the same tool: crime data next to context, not floating alone.

Chicago shaded by reported crimes over the trailing 12 months with Color By set to Ward — the legend runs from 1,918 to 10,899 crimes per ward — over a satellite basemap, with the left panel explaining that ward values roll up from blocks and the Data panel’s indicator groups on the right.

Down to the census block

Where USDataSo stops at the census tract, Chicago SaidSo keeps going — 38,790 census blocks with 2020 population, race and ethnicity, age, and housing counts. The app is explicit about which variables exist at which depth: block-level where the Census actually publishes it, tract-level ACS estimates labeled as such, and inherited values named as inherited.

The Chicago SaidSo city view shaded by median household income (ACS 2023) at census-tract level, with City / Tract / Block group / Block drill levels on the left and the Data panel’s 170 indicators on the right — Population rows carrying “aggregated from block” and “derived” provenance tags.

Elections, precinct by precinct

2024 presidential results across 1,291 precincts from the Board of Elections, 2020 and the 2023 mayoral race from the Chicago Elections Archive, and a computed 2020 → 2024 shift — rollable to any geography. Every figure is labeled vote share, never "party affiliation": Illinois has no party registration, and the app treats that as a labeling rule it enforces, not a footnote.

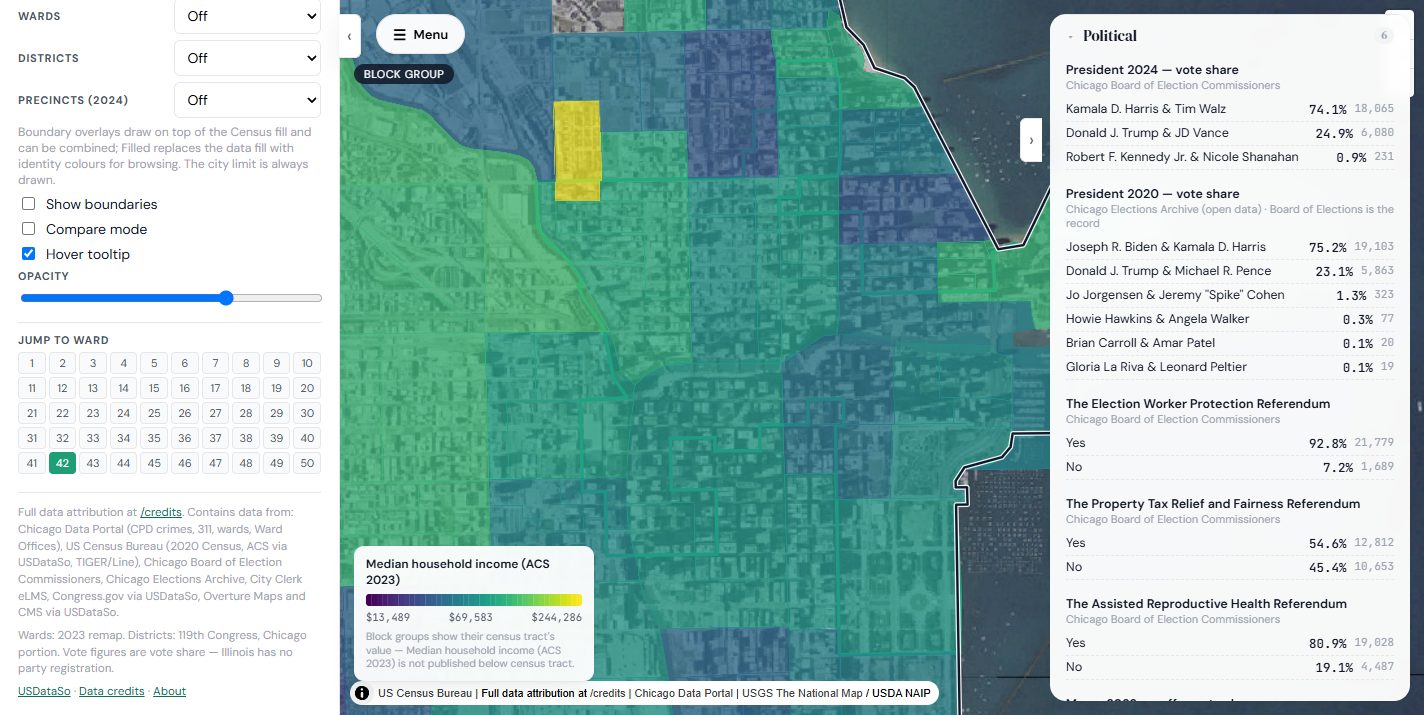
The Political section of the Data panel for Ward 42: President 2024 vote share (Harris 74.1%, Trump 24.9%) credited to the Chicago Board of Election Commissioners, President 2020 credited to the Chicago Elections Archive marked open data with the Board named as the record, and three citywide referenda with Yes/No shares and raw vote counts.

FAQ

Honest answers

Is this an official City of Chicago site?
No. Chicago SaidSo is an independent public-service project built entirely on data the City and other public bodies already publish — the Chicago Data Portal, the City Clerk, the Board of Elections, the U.S. Census Bureau. Every number links back to its source, and the app names the official portal (like CPD's ClearMap) wherever one exists.
Why only 12 months of crime and 90 days of 311?
Deliberate windows, stated in the UI. Chicago publishes crime back to 2001 and millions of 311 rows a year; serving all of it would make this a data warehouse, not a free explorer. A trailing 12 months of crime (~225,000 incidents) and 90 days of 311 (~600,000 requests) keep every view current, fast, and honest — and both refresh themselves nightly. No filter combination quietly widens a window.
Why is a ward’s 311 map count lower than its ticket list?
Two request types — "311 information only" calls and aircraft-noise complaints — are stamped with a department address rather than an incident location, so mapping them would pile roughly 46% of citywide 311 volume onto two buildings and distort every ward's numbers. They're excluded from geographic counts, still fully readable in the ticket browser, and the exclusion is disclosed in the app everywhere it matters.
Are the crime pin locations exact addresses?
No — and that's upstream, by design. CPD publishes incidents at the block level (block-face midpoints), which is what the map draws. Chicago SaidSo assigns each incident's ward, tract, district, and precinct from that published point, and its verification harness re-derives those assignments with independent geometry to make sure they hold.
Why does the election map say "vote share" instead of party?
Illinois has no party registration, so presidential vote choice is a proxy, not a measure of affiliation. Every political figure is labeled vote share or vote lean, the caveat travels with the legend, and the build's automated checks assert the phrase "party affiliation" never appears outside that caveat.
What about the real-time traffic and transit layers?
Built, and honestly labeled. The City's Traffic Tracker feed stopped publishing upstream on April 30, 2026, so the traffic layer shows its last snapshot marked stale rather than pretending to be live. CTA and Metra positions use GTFS-Realtime feeds that require issued API keys; until those are active the layer says "pending" instead of erroring.
How does this relate to USDataSo?
USDataSo is the national tool; Chicago SaidSo is its city-scale sibling — a fresh codebase following the same design patterns, sharing one backend so federal layers (Census, CDC, EPA, CMS, Congress) come along for free, then adding what only exists at city scale: crime, 311, wards, block-level counts, precinct elections.
Could my city have one of these?
That's the intent. Chicago is the first implementation of a repeatable city pattern — a standalone, forkable structure another community could stand up on its own open-data portal without touching this deployment. If you're interested, say so below.

About the creator

Built by Kyle Ewing

Kyle Ewing is an IT program and project leader who builds working software to prove a point: with AI as a genuine development partner, one person can deliver what used to take a team. Chicago SaidSo is part of that portfolio — planned, documented, and shipped with the same rigor as an enterprise delivery, on public data and an open stack.

LinkedIn ↗linkedin.com/in/kyle-s-ewingITprojectMGMT.com ↗Program & project deliveryTheAIDoodle.com ↗The Doodle Principle

Get in touch

Suggest, correct, improve.

A public data tool is only as good as the people checking it. Spotted a number that looks wrong, a view that misbehaves, or a layer you wish existed? Say so.

This composes a pre-filled message to hello@saidso.co in your own email app — it sends from your mailbox, and this site stores nothing.

See what the city's data says about your block

No sign-up, nothing to install. Open the map, find your ward, and keep clicking.

Open Chicago SaidSo →

chicago.saidso.co